This web page was created as an assignment for Genetics 677, an undergraduate course at UW-Madison.
Protein Homology and Phylogeny
Alignments were carried out using FASTA amino acid sequences of the LMNA gene in the human, mouse, rat, Rhesus monkey, zebrafish, chimpanzee, pig, and cow. All alignment programs were done using default settings. Each section of this page gives a brief overview of the different programs used. The homolgy section at the end of this page gives a brief analysis of the results obtained by these programs.
Phylogeny.fr
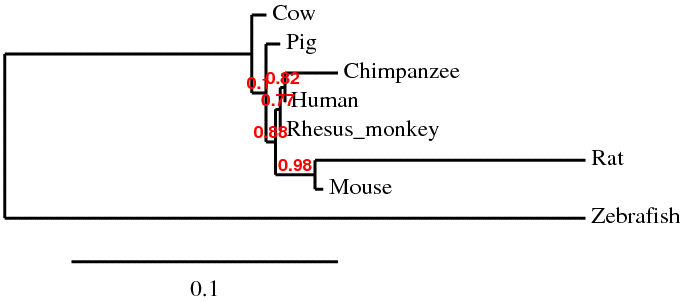
Phylogeny.fr is an easy way to generate a set of sequence alignments and phylogenies. The default setting uses a "one click" method which allows the available software to optimally align the sequences. The optimization for the input sequence detailed in this section used MUSCLE software for alignment, followed by curation with Gblocks. Next phylogeny was generated with PhylML and tree rendering done by TreeDyn. The program allows you to look at the alignments carried out as well as the curation, in addition to the phylogeny generated.
T-COFFEE
T-COFFEE is a multiple sequence alignment program. The main advantage of T-COFFEE is that it allows you to use sequences alignments done by other alignment programs and combine them to generate a new sequence alignment. For this particular alignment I used BLAST and ClustalW results to generate a new alignment. The default settings of T-COFFEE compares all input sequences two by two, creating a global alignment with a series of local alignment, which is done by Lalign. The program then combines all of these alignments to create a consensus alignment. Below is a file of the T-COFFEE alignment results. T-COFFEE generated a score of 72 for the protein sequence.
| tcoffee_align.rtf | |
| File Size: | 41 kb |
| File Type: | rtf |
ClustalW2
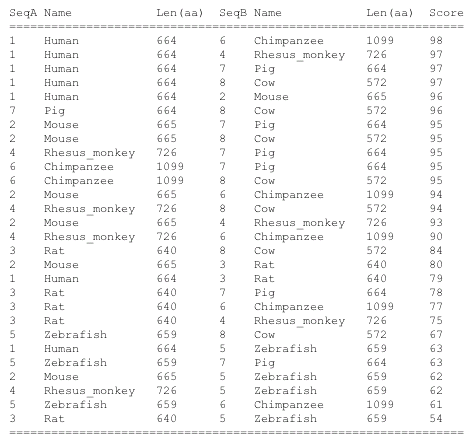
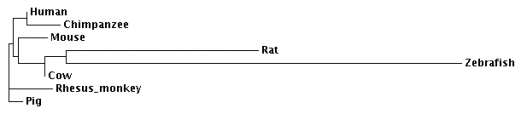
ClustalW2 is a multiple sequence alignment software that produces biologically meaningful alignments between divergent species. The program begins by computing pairwise alignments which are used to calculate distances by looking at the non-gapped positions and by counting the number of mismatches between two sequences. This data is then put in a matrix and a similarity tree is constructed using Neighbor-Joining. Lastly a phylogram is constructed. There is a wide range of options for this alignment outside of the default setting which can allow a user to better specify certain aspects of the alignment. Also interactive results, available for a length of time, can be emailed to you for convenience. The strength of this software is the amount of results it gives you, both alignments and phylogeny, as well as the ability to edit your search and results, which can be done using Jalview. To the left are the alignment scores and beneath is the phylogeny constructed from the scores. A file with the aligment is below the phylogram as well.
| homolog_align.rtf | |
| File Size: | 36 kb |
| File Type: | rtf |
STRING
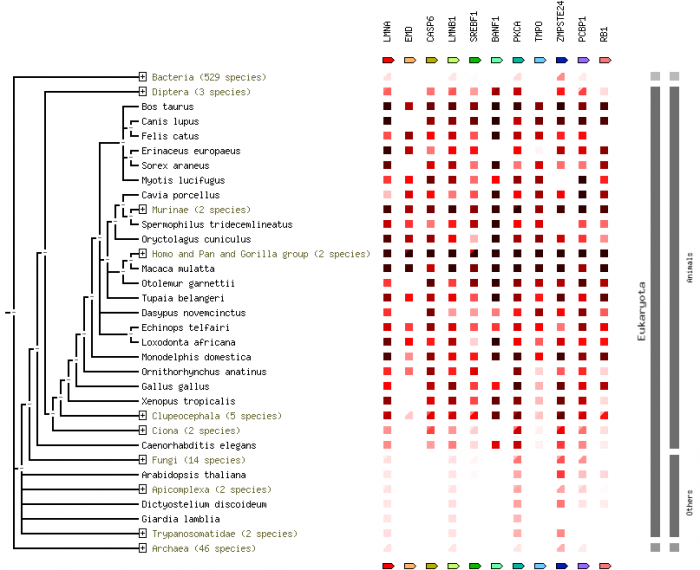
More information about STRING software can be found in the Protein Networks section. This phlyogram, called on occurrence in STRING, shows the level of conservation of a specific gene throughout many species. The darker the red in the box to the right of the tree indicates increased conservation of that gene. Clicking on the image will give an enlarged view.
Results Analysis
The phylogenies generated by Phylogeny.fr seemed to be the best suited, where the one generated by ClustalW2 did not seem to fit the data. For the ClustalW2 phylogram the branch for the Rhesus monkey should be right next to the human and chimp according to the scores given by the alignment. Also the zebrafish should not be ortholgous with the rat. The sequences were run several times with the same phylogram. For these reasons this phylogeny seems to be innacurate. Since this is such a conserved gene product, the algorithm used may put more weight on a portion of the sequence that does not seem to match the overall homology of the organisms. Conservation of the gene is apparent by the similarity in sequences. The human has scores over 90 for all animals seqeunced besides the rat and zebrafish. Even in the zebrafish a score of 63 was generated, which makes it probable similar gene products are made. The occurrence diagram from STRING is very interesting in giving a good visual of the conserved homology across species. Also it includes several genes in organisms and how well conserved each is.
References
1) Larkin M.A., Blackshields G., Brown N.P., Chenna R., McGettigan P.A., McWilliam H.*, Valentin F.*, Wallace I.M., Wilm A., Lopez R., Thompson J.D., Gibson T.J. and Higgins D.G. (2007) ClustalW and ClustalX version 2. Bioinformatics 2007 23(21): 2947-2948.
2) Notredame C., Higgins D., Heringa J. (2000) T-Coffee: A novel method for multiple sequence alignments. Journal of Molecular Biology 302: 205-217.
3) Dereeper A., Guignon V., Blanc G., Audic S., Buffet S., Chevenet F., Dufayard J.-F., Guindon S., Lefort V., Lescot M., Claverie J.-M., Gascuel O. Phylogeny.fr: robust phylogenetic analysis for the non-specialist Nucleic Acids Research. 2008 Jul 1; 36 (Web Server Issue):W465-9. Epub 2008 Apr 19.
4) STRING information taken from: string.embl.de
Peter St. Andre [email protected] Last updated:2/3/09
gen677.weebly.com
